FlowAnalyzer
Table of Contents
1 Overview
What is FlowAnalyzer?
- FlowAnalyzer is a piece of software, based on Optical Flow Analysis (OFA), for extracting motion from 2D video sequences
- Optical Flow Analysis (OFA) is a quantitative method for measuring motion from video. It is based on a computer vision algorithm known as Optical Flow
- As an example, consider this video of a metronome. When submitted to Optical Flow Analysis, it produces the following motion signal:

Why to use Optical Flow Analysis?
- Non-invasive (measurement does not interfere with the speech production process)
- Portable (data acquisition can take place out of the lab)
- Automated
- Fast
- Objective
How does Optical Flow Analysis work?
- Optical flow computes pixel displacements between consecutive frames in the video
- All pixel displacements are represented and stored as velocity vectors
- x and y components (cartesian coordinates)
- magnitude and direction (polar coordinates)
- The array of velocity vectors comprises the optical flow field
- Flow fields can be visualized in at least two different ways:
Regions of interest and disinterest
- Rectangular regions of interest (ROIs) and disinterest (RODs) can be defined
- All velocity vectors within each region of interest are combined into a single measure
- Motion within regions of disinterest is ignored
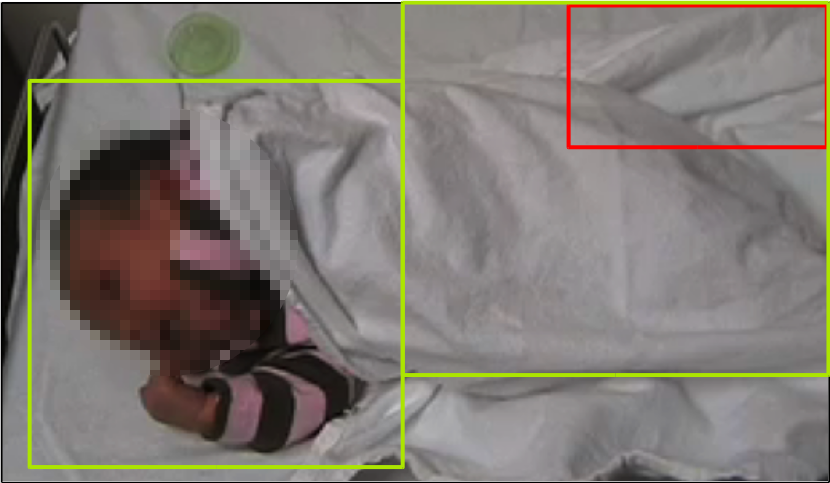
- By combining regions of interest and disinterest, it’s possible to create non-rectangular regions of interest, as shown below
Computing Motion Signals
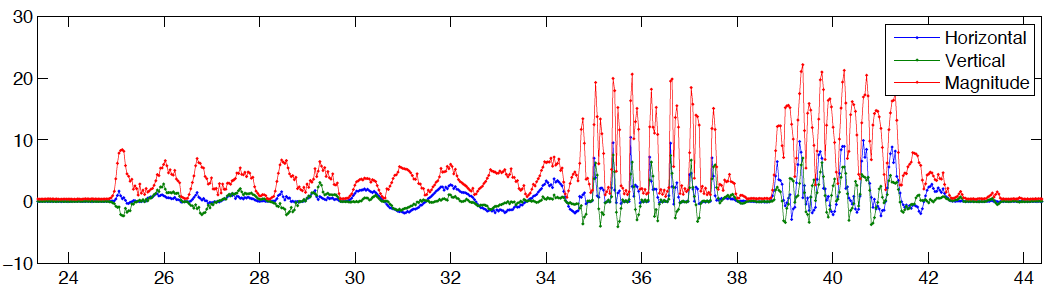
- All velocity vectors inside each region of interest are summed for each frame in the video
- This creates horizontal, vertical and magnitude motion signals as a function of time
2 Installation
Standalone application (Mac OS only)
There is a DMG installation file for Mac OSX available here. Note, however, that this only installs the FlowAnalyzer GUI. Auxiliary scripts (such as for batch processing, creating flow movies, etc) won't be installed in this case.
General method (Linux, Mac, Windows)
Download FlowAnalyzer
First, download the FlowAnalyzer software from here.
Install Python
FlowAnalyzer is written in Python. In order to run it, you need to have Python 2.7 and all the required libraries installed on your computer. The easiest way to achieve this (at least on Windows and Mac OSX) is by using miniconda. Installation files and instructions can be found here and here, respectively. Important: make sure you install miniconda for Python 2.7, not Python 3.x.
Install the required Python libraries
Now, you need to install the required Python libraries. In order to do that, issue the commands below in a terminal window.
Mac OSX:
conda upgrade --all
conda install matplotlib=1.3.1 pytables=3.0.0 pillow=2.7.0 pyqt=5.6.0 opencv=2.4.8 xlrd=1.0.0 xlwt=1.1.2
Windows:
conda upgrade --all
conda install matplotlib=1.5.3 pytables=3.3.0 pillow=3.4.2 pyqt=5.6.0 xlrd=1.0.0 xlwt=1.1.2
On Windows, the OpenCV packages available from miniconda can't handle videos, what makes them useless for our purposes. However, the OpenCV packages available from Christoph Gohlke's page work fine. Go to his page and download version 2.4.x (not 3.x) of the OpenCV package for your architecture (32 or 64 bits). As a convenience, these packages are also available from here (32 bits) and here (64 bits). After downloading the appropriate file, install it using the pip command:
pip install file_name
where file_name is the name of the downloaded file (with a .whl extension).
If you use Linux, you probably don't need miniconda, as the required libraries are likely available through your distribution's package manager (although you can still use miniconda if you want). For example, in Debian/Ubuntu the required libraries can be installed with the following command:
sudo apt-get install python-matplotlib python-tables python-imaging python-xlrd python-xlwt python-pyqt5 python-opencv
Finally, you need the py-notify module, which only seems to be available through pip. In order to install py-notify through pip, issue the following command in a terminal window:
pip install py-notify
If the command above fails (for example, because you don't have a C compiler installed – something quite common on Windows and Mac OSX), you can use the pre-compiled binaries below:
Download the appropriate file for your architecture and uncompress it in the same folder where the FlowAnalyzer.py script is located, or put it somewhere in your Python path.
3 Quick Start Guide
Running FlowAnalyzer
Unzip the optical_flow.zip archive downloaded in the previous section, enter the created folder (optical_flow/python) and, from there, open a terminal window and do:
python FlowAnalyzer.py
This will bring up the interface shown in Figure 1.
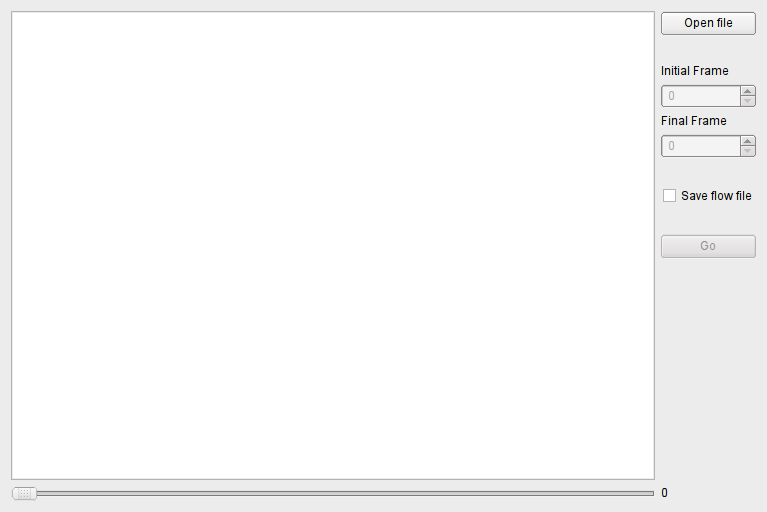
Figure 4: Initial window of the Optical Flow GUI.
Click on the button “Open File” to choose the video file to be analyzed. The first frame of the video will be shown in the interface (Figure 2). You can use the slider at the bottom of the window to browse the video.
If you don't want to analyze the whole video file, you can use the “Initial Frame” and “Final Frame” spinboxes to define the segment of interest to be analyzed.
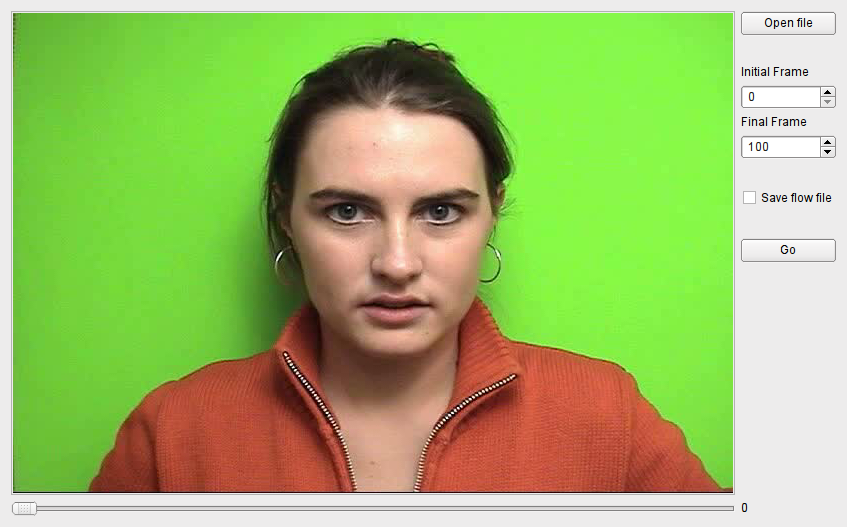
Figure 5: Optical Flow GUI after a video file has been loaded.
Click somewhere on the image frame and use the mouse to define a rectangle. When you release the mouse button, you will be presented with a dialog box where you can choose the region's name and type (interest or disinterest) (Figure 3). You can define as many regions as you want. The algorithm will compute one motion signal for each region of interest defined.
Motion within regions of disinterest is completely ignored. This is useful when there are regions in the image frame whose motion we need to ignore (e.g., a running time stamp somewhere in the frame). It's interesting to note that by defining overlapping regions of interest and disinterest we can create what's effectively non-rectangular regions of interest (Figure 4).
After defining all regions, click the button “Go” to run the analysis. Depending on the video's resolution and frame rate and on the number of frames to be processed, this may take a long time.
Once the analysis is finished, a figure is plotted showing all the computed motion signals (Figure 5). There is one such signal per region of interest. This figure is exported to disk as a pdf file.
The computed motion signals are saved to disk as an Excel spreadsheet and also as an HDF file (http://www.hdfgroup.org/). The contents of both files are exactly the same.
The HDF motion file can be loaded into Matlab by using the scripts available in the folder matlab. For instructions on how to load and plot the motion signals in Matlab, have a look at the script sample.m in that folder.
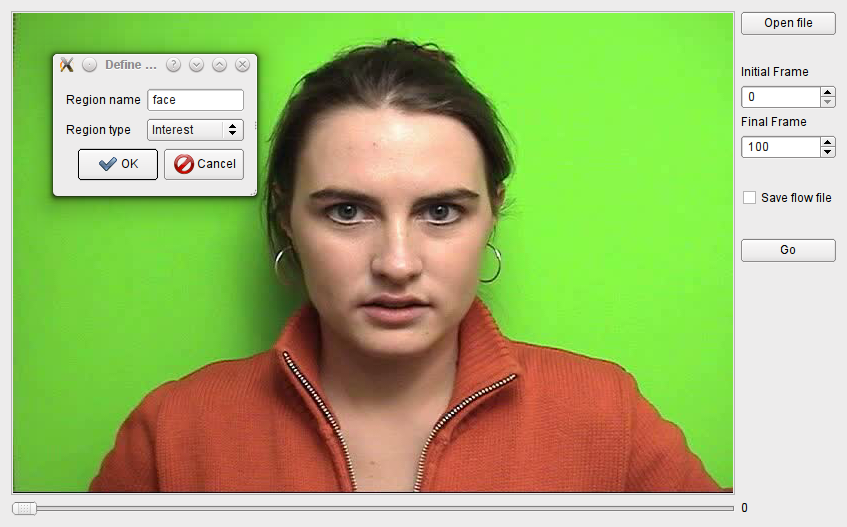
Figure 6: Defining a region of interest in the Optical Flow GUI.
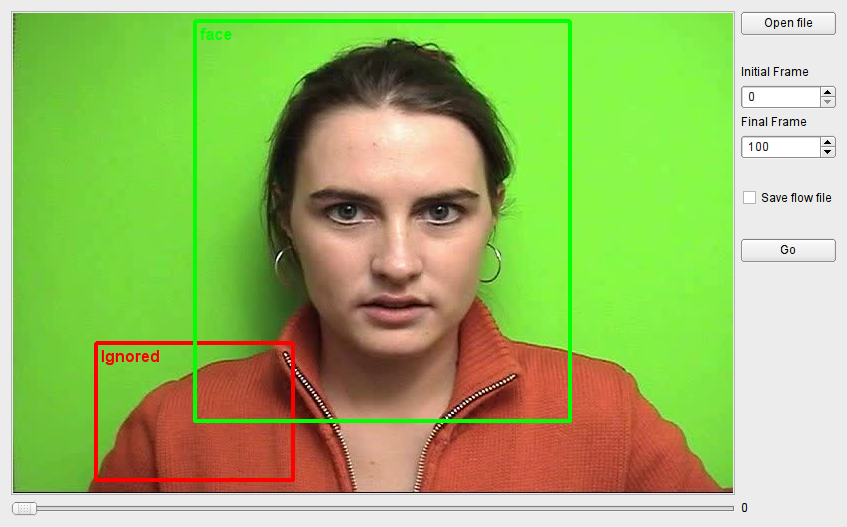
Figure 7: Regions of interest and disinterest.
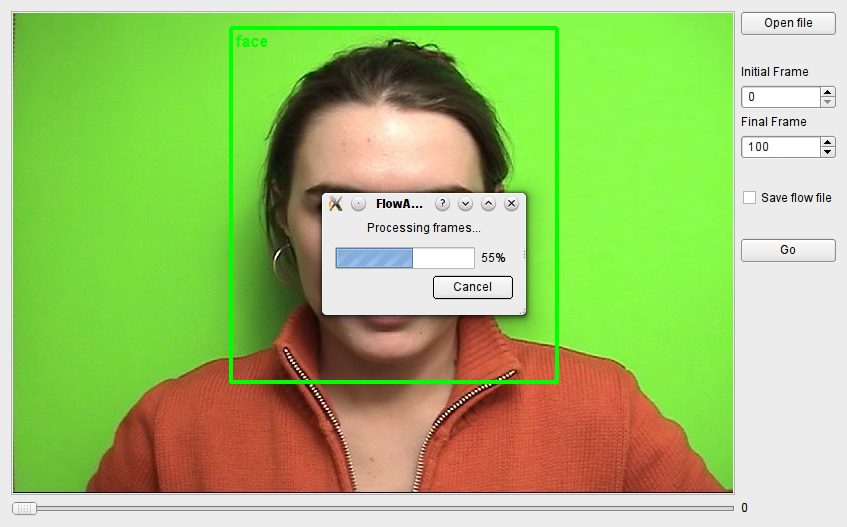
Figure 8: Motion signals computed from optical flow.
4 Auxiliary tools
The FlowAnalyzer software defines an API and provides a set of tools for performing optical flow analysis on videos. The FlowAnalyzer GUI is the most commonly used of these tools and for many users it may be all they need. Nevertheless, there are some additional tools to help users with some specific tasks, as listed below:
flow_analyzer.py- this is a command line version of FlowAnalyzer.py. It allows you to perform optical flow analysis of a movie file without interacting with the GUI. This is useful when you need to process a movie non-interactively.batch_processing.py- this script batch processes all the movie files in a given directory.create_flow_movie.py- this script creates a flow movie from a flow field (hdf) file. In the future, this functionality will be incorporated into the FlowAnalyzer application so that extracting the motion signals and creating the flow movie can be done in parallel, in a single pass. This will make it unnecessary to create the intermediate flow field file (which can be quite big depending on the duration and resolution of the movie under analysis).read_flow_signals.py- this script imports a motion signals file into Pythonread_flow_signals.m- this script imports a motion signals file into Matlab